The UK’s electric vehicle charging infrastructure is growing faster than ever. With over 2.1 million fully electric cars now on British roads and 121,000+ public charge points installed, 2026 marks a turning point for EV adoption. Whether you’re considering a home EV charger or relying on the public network, understanding these numbers helps you make smarter decisions about going electric.
We’ve compiled 25 verified statistics covering EV adoption, home and public charging infrastructure, costs, and government policy – sourced from Zap-Map, the DfT, SMMT, and OZEV.
FREE QUOTE COMPARISON
Compare EV Charger Installation Quotes from Trusted Suppliers
✓ OZEV-approved local installers
100% free • No obligation • Takes under 2 minutes
- 2.1 million battery-electric cars on UK roads - representing 6.1% of the total car parc as of June 2026 (Zap-Map)
- 23.4% of new cars sold in 2025 were fully electric - up from 19.6% in 2024 and just 16.6% in 2022 (SMMT/Zap-Map)
- 121,171 public charge points installed - with 24% rated rapid or ultra-rapid and the network growing 10% year on year (Zap-Map, June 2026)
- Home charging costs 2-8p per mile - compared with about 19p per mile for petrol, saving over £1,000 per year at 10,000 miles (ExpertSure calculation, 2026)
- 403,733 government-funded domestic chargers installed - OZEV grant schemes have invested over £200 million since 2013 (DfT, Jul 2025)
EV Adoption Statistics
The UK’s shift to electric vehicles has accelerated dramatically. In just four years, the number of fully electric cars on British roads has nearly tripled from 664,148 at the end of 2022 to over 2.1 million by June 2026. Here are the key adoption figures.
1. There are over 2,100,000 fully electric cars registered in the UK. As of June 2026, battery-electric vehicles represent approximately 6.1% of the 34 million cars on UK roads. Including plug-in hybrids, the total rises to 3,249,784 plug-in vehicles. Source: Zap-Map, June 2026.
2. 473,348 new electric cars were registered in 2025. This represents 23.4% market share of all new car registrations – an increase of 91,378 units compared to 2024. The ZEV mandate target of 28% was not met, but growth remains strong. Source: SMMT/Zap-Map, January 2026.
3. EV market share has grown from 6.6% in 2020 to 23.4% in 2025. The trajectory shows consistent year-on-year growth: 11.6% (2021), 16.6% (2022), 16.5% (2023), 19.6% (2024), and 23.4% (2025). Including PHEVs, plug-in vehicles reached 34.5% of new sales in 2025. Source: Zap-Map, March 2026.
4. December 2025 saw the highest monthly EV market share of 2025 at 32.2%. Nearly one in three new cars registered in December 2025 was fully electric, the only month of the year above the 28% ZEV mandate target. Across the 12 months to September 2026, monthly battery-electric share ranged from about 20% to 32%. Source: SMMT, January 2026; Zap-Map, October 2026.
5. The Tesla Model Y was the UK’s best-selling EV in 2025 with 24,298 registrations. The Tesla Model 3 followed with 21,188 units, and the Audi Q4 e-tron took third place with 14,433 registrations. Source: Car Magazine/SMMT, January 2026.
| Year | New BEV Registrations | BEV Market Share | Total BEV on Road |
|---|---|---|---|
| 2022 | 267,203 | 16.6% | 664,148 |
| 2023 | 314,684 | 16.5% | 978,832 |
| 2024 | 381,970 | 19.6% | 1,360,802 |
| 2025 | 473,348 | 23.4% | 1,834,150 |
| 2026 (YTD to Sept) | 454,947 | 26.2% | 2,280,000+ |
All registration figures are sourced from Zap-Map and the SMMT. BEV = battery-electric vehicle (fully electric). PHEV = plug-in hybrid electric vehicle. The 2026 year-to-date row covers January to September 2026.
6. 274,815 used electric cars were sold in 2025. This represents a 45.7% year-on-year increase in the second-hand EV market, demonstrating growing consumer confidence in pre-owned electric vehicles. Source: SMMT, January 2026.
7. Over 105,000 electric vans are registered in the UK. As of February 2026, electric vans represent approximately 2.1% of all light commercial vehicles on UK roads. In 2025, 27,789 new electric vans were registered – a 35.5% increase on 2024. Source: Zap-Map, March 2026.
Home Charging Statistics
Home charging remains the most convenient and cost-effective way to power an electric vehicle. The vast majority of EV owners in the UK charge primarily at home, typically overnight on cheaper electricity tariffs. If you’re weighing up installation costs, these figures provide useful context.
8. Around 80% of UK EV drivers usually charge at home. A Zenith survey of more than 3,600 drivers found 80% usually charge off-street at home (up from 76% in 2024), and DfT research found 91% of battery-electric drivers can charge at home. The public network is used mainly for longer journeys. Source: Zenith EVXperience, 2025; DfT/Ipsos EV Driver Tracker, 2025.
9. Over 400,000 domestic EV chargers have been installed through government grant schemes. The EVHS (2014-2022) funded 340,222 installations worth £140.8 million. Its successor, the EV Chargepoint Grant (EVCG), has funded a further 23,178 sockets since April 2022 at a cost of £16.6 million. The separate Domestic Recharge Scheme added 40,333 installations. Source: DfT/OZEV, July 2025.
10. A typical home EV charging session uses 30-40 kWh and takes 4-8 hours. Using a standard 7kW home wallbox, a full charge from 20% to 80% on a 60 kWh battery takes approximately 5-6 hours. Most EV owners schedule overnight charging to take advantage of off-peak electricity rates as low as 7-9p per kWh. Source: Zap-Map/Energy Saving Trust, 2025.
11. The average cost of installing a home EV charger is £800 to £1,200. This includes the charger unit (£400-£800) and professional installation (£300-£500). Government grants of up to £500 are available for eligible renters and flat owners, reducing the effective cost to £300-£700. Source: Checkatrade/The Guardian, 2025-2026.
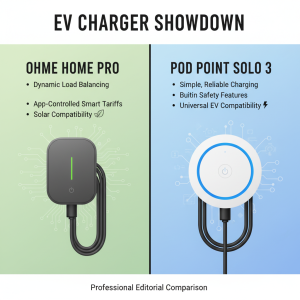
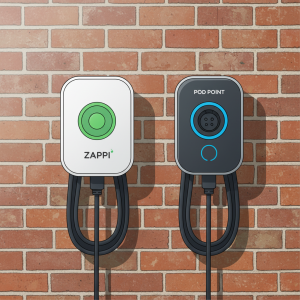
12. The most popular home charger brands in the UK include Ohme, Pod Point, Easee, Hypervolt, and myenergi Zappi. Smart chargers dominate the market, offering app control, energy tariff integration, and solar compatibility. The myenergi Zappi is particularly popular with solar panel owners for its solar energy diversion feature. Source: Industry analysis, 2025.
| Home Charging Metric | Figure | Source |
|---|---|---|
| EV owners who primarily charge at home | ~80% | Zenith EVXperience 2025 |
| Govt-funded domestic chargers installed (all schemes) | 403,733 | DfT/OZEV Jul 2025 |
| Average home charger installed cost | £800-£1,200 | Checkatrade 2026 |
| EVCG grant for renters/flat owners | Up to £500 | OZEV 2026 |
| Typical 7kW charge time (20%-80%) | 5-6 hours | Energy Saving Trust |
| Typical off-peak EV tariff rate | 7-9p/kWh | What Car? 2025 |
Public Charging Infrastructure Statistics
The UK’s public charging network has expanded significantly, with over 121,000 charge points now installed. The government’s target is 300,000 public charge points by 2030. Here is how the network currently looks.
13. There are 121,171 public EV charge points installed across the UK. This figure, reported by Zap-Map as of June 2026, covers 46,731 charging locations and includes all public access chargers from standard on-street units to ultra-rapid motorway chargers. The network has grown 10% year on year. Source: Zap-Map/DfT, June 2026.
14. Around 24% of public chargers are rapid or ultra-rapid (50kW+). As of June 2026 there are 28,887 rapid or ultra-rapid chargers across 7,005 locations – roughly 24% of all devices but around 60% of total charging capacity. The segment is growing fastest at 16% year on year, particularly at motorway service areas and retail hubs. Source: Zap-Map, June 2026.
15. London has 338 public chargers per 100,000 residents – double the national average. The UK average is 168 chargers per 100,000 population. Scotland follows with 218, while Northern Ireland lags significantly at just 58 per 100,000. However, London has the second-lowest proportion of rapid chargers per capita. Source: DfT, January 2026.
16. 54% of public chargers are at destination locations, 32% are on-street. Destination chargers (car parks, hotels, retail) form the largest category. On-street residential chargers account for 32%, en-route chargers (motorway services, forecourts) make up 9%, and other semi-public locations represent 4%. Source: DfT, January 2026.
17. 17.1% of public chargers are in rural areas. This closely matches the 17.5% of the England and Wales population living in rural areas, suggesting broadly proportional distribution. Urban areas contain 82.9% of chargers. Source: DfT, January 2026.
| Region | Chargers per 100,000 | Rapid+ per 100,000 |
|---|---|---|
| London | 338.1 | 25.6 |
| Scotland | 217.5 | 53.8 |
| Wales | 177.1 | 39.9 |
| West Midlands | 159.8 | 41.4 |
| South East | 149.4 | 36.4 |
| South West | 148.0 | 45.7 |
| East of England | 140.9 | 44.0 |
| North East | 138.9 | 32.3 |
| East Midlands | 120.9 | 43.3 |
| Yorkshire and the Humber | 108.5 | 33.2 |
| North West | 104.9 | 36.9 |
| Northern Ireland | 57.5 | 16.7 |
| UK Average | 167.5 | 38.1 |
Regional charger data is from the DfT’s official Electric Vehicle Public Charging Infrastructure Statistics (January 2026), which uses data collated by Zap-Map from individual charge point operators under the Public Charge Point Regulations 2023. Per capita figures use ONS mid-year population estimates.
FREE QUOTE COMPARISON
Compare EV Charger Installation Quotes from Trusted Suppliers
✓ OZEV-approved local installers
100% free • No obligation • Takes under 2 minutes
EV Charging Cost Statistics
One of the biggest advantages of driving an EV is the lower running cost. Home charging is significantly cheaper than petrol or diesel, though public rapid charging narrows the gap. Here are the latest cost comparisons for UK drivers.
18. Home EV charging costs 2-8p per mile, compared with about 19p per mile for petrol. At the Ofgem price cap electricity rate of 26.32p per kWh (October to December 2026), charging a typical EV with 3.5 miles-per-kWh efficiency costs approximately 7.5p per mile. On off-peak tariffs (7-9p/kWh), this drops to 2-3p per mile. Petrol at around £1.70/litre in a car averaging 40 mpg costs roughly 19p per mile. Source: Ofgem; DESNZ weekly road fuel prices, September 2026; ExpertSure calculation.
19. EV drivers who charge at home save over £1,000 per year on running costs compared with petrol drivers. On 10,000 miles a year, the cost-per-mile figures in the table below put the saving at roughly £1,100-£1,700 for home charging. The Energy and Climate Intelligence Unit estimates that popular second-hand EVs save owners about £1,450 per year across total cost of ownership, even after the planned 3p-per-mile EV road tax from April 2028. Source: ECIU, 2025; ExpertSure calculation.
20. Public slow/fast charging averages 54p per kWh; rapid/ultra-rapid averages 79p per kWh. According to the Zap-Map Price Index, the weighted average cost at slow/fast chargers (up to 49kW) is 54p/kWh. Rapid and ultra-rapid chargers (50kW+) average 79p/kWh, and the ten biggest rapid networks ranged from 59p to 92p per kWh in September 2026. Source: Zap-Map Price Index, September 2026.
21. Public rapid charging prices have edged up about 4% in the past year. The Zap-Map Price Index shows both the 3-49kW and 50kW+ bands roughly 4% higher than a year earlier, so the premium for rapid charging has not narrowed. At 79p/kWh, rapid charging works out at about 24p per mile in an average EV, against about 16p per mile at slower public chargers. Source: Zap-Map Price Index, September 2026.
| Fuel Type | Cost per Mile | Annual Cost (10,000 miles) | Annual Saving vs Petrol |
|---|---|---|---|
| EV (home off-peak tariff) | 2-3p | £200-£300 | £1,600-£1,700 |
| EV (home standard tariff) | 7-8p | £700-£800 | £1,100-£1,200 |
| EV (public slow/fast) | 15-16p | £1,500-£1,600 | £300-£400 |
| EV (public rapid/ultra-rapid) | 22-24p | £2,200-£2,400 | -£300 to -£500 (more expensive) |
| Petrol (avg 40 mpg at £1.70/L) | ~19p | ~£1,900 | – |
| Diesel (avg 45 mpg at £1.93/L) | ~19p | ~£1,900 | – |
Public rapid charging can cost more than petrol per mile. If you cannot charge at home, factor public charging costs into your EV ownership calculations. Our EV charger installation cost guide explains how to get a home charger fitted affordably.
Government Policy and Grant Statistics
The UK government supports EV adoption through grant schemes, infrastructure investment, and regulatory policy. From OZEV grants for home and workplace chargers to the ZEV mandate for manufacturers, here are the key policy statistics.
22. Over 403,000 domestic chargers have been funded through OZEV schemes. That total is 340,222 EVHS installations, 40,333 DRS installations and 23,178 EVCG sockets (403,733). The Workplace Charging Scheme has funded a further 63,777 sockets. Total government grant expenditure exceeds £200 million. Source: DfT/OZEV, July 2025.
23. The Workplace Charging Scheme has funded 63,777 sockets across the UK. Since launching in 2016, the WCS has supported 28,800 voucher redemptions. In the 12 months to July 2025, 7,924 new workplace sockets were installed. The South East leads with 9,295 sockets, while London has the lowest uptake at 45 installations per 100,000 population. Source: DfT/OZEV, July 2025.
24. The WCS grant increased from £350 to £500 per socket on 1 April 2026. The enhanced Workplace Charging Scheme grant represents a 43% increase in per-socket funding. The grants for renters, flat owners and residential landlords also rose to up to £500 from April 2026, and the schemes are open until 31 March 2027. Source: GOV.UK, 2026.
25. Sales of new pure petrol and diesel cars end in 2030, and all new cars and vans must be zero-emission from 2035. Hybrids can still be sold until 2035. The ZEV mandate requires manufacturers to sell increasing percentages of zero-emission cars each year: 28% in 2025, 33% in 2026, rising to 80% by 2030. Manufacturers face fines of up to £12,000 per car for non-compliance. Source: DfT/GOV.UK, 2025.
| Grant Scheme | Total Sockets Installed | Grant Value | Status |
|---|---|---|---|
| EVHS (Homecharge Scheme) | 340,222 | £140.8M | Closed (replaced by EVCG) |
| DRS (Domestic Recharge Scheme) | 40,333 | N/A | Closed (replaced by EVHS) |
| EVCG (Chargepoint Grant) | 23,178 | £16.6M | Open (renters/flats/landlords) |
| WCS (Workplace Charging) | 63,777 | Under review | Open (£500/socket from Apr 2026) |
| ORCS (On-Street Residential) | 13,325 | £47.1M | Closed to new applicants |
Since 1 April 2026, the Workplace Charging Scheme grant has been £500 per socket, for up to 40 sockets, and the scheme is open until 31 March 2027. If your business is planning to install EV chargers, apply before the deadline and wait for approval before work starts, as installations completed before approval are not eligible. See our complete guide to EV charger grants for eligibility details.
FREE QUOTE COMPARISON
Compare EV Charger Installation Quotes from Trusted Suppliers
✓ OZEV-approved local installers
100% free • No obligation • Takes under 2 minutes
UK EV Charging: What the Data Tells Us
The statistics paint a clear picture: the UK’s transition to electric vehicles is well underway and accelerating. With nearly one in four new cars sold now fully electric, the charging infrastructure is racing to keep pace.
Home charging remains the backbone of daily EV use – cheaper, more convenient, and increasingly accessible through government grants. The public network is expanding but unevenly distributed, with London far ahead on total chargers while Scotland leads on rapid charging provision per capita.
The cost advantage of EVs is most pronounced for drivers who can charge at home on off-peak tariffs, where running costs drop to as low as 2p per mile. For those relying solely on public rapid chargers, the financial benefit narrows significantly and can even reverse.
With the WCS grant now at £500 per socket, the 2030 end of pure petrol and diesel car sales approaching, and home charger technology improving, the economic case for switching to electric continues to strengthen.
Sources and Methodology
All statistics in this article are sourced from official government publications and established industry data providers. We update this page quarterly as new data becomes available.
| Source | Data Used | Publication Date |
|---|---|---|
| Zap-Map (zapmap.com) | EV registrations, public charge point counts, charging price index | March 2026 |
| DfT – EV Public Charging Infrastructure Statistics | Regional distribution, power ratings, location classifications | January 2026 |
| DfT/OZEV – EV Charging Device Grant Scheme Statistics | Grant-funded installations (EVHS, EVCG, WCS, ORCS, DRS) | July 2025 |
| SMMT (smmt.co.uk) | New and used car registration data | January 2026 |
| ECIU (eciu.net) | EV running cost comparisons and annual savings | 2025 |
| GOV.UK | ZEV mandate targets, grant scheme changes, 2030 and 2035 phase-out dates | March 2026 |